
Bitcoin Optech Dashboard
This summer I was an intern for Bitcoin Optech, working on a Bitcoin metrics dashboard. In this post I’ll be describing the purpose of the dashboard and how it was implemented.
The goal of the Optech dashboard is to show a variety of metrics of how effectively blockspace is being used. Important metrics are those that show activity like:
- batching: combining the outputs of what would otherwise be many different transactions into a single transaction
- consolidations: combining many UTXOs in a single UTXO during low fee period, to avoid paying a higher fee in the future
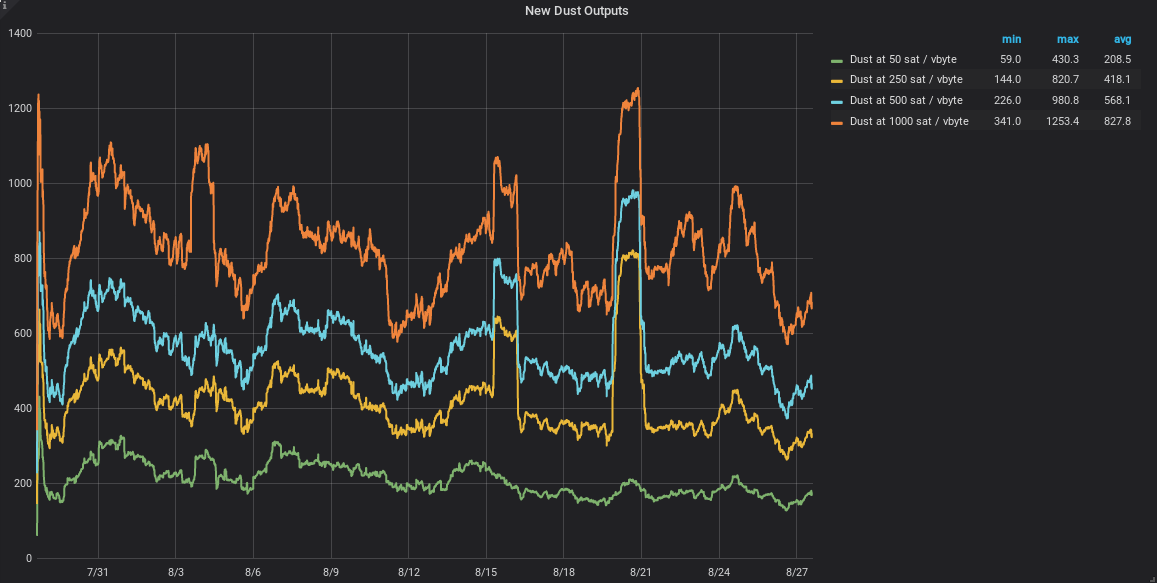
- dust creation: creation of UTXOs that cost more to spend than they have value, at different fee-rates
- SegWit adoption: creation of and spending from SegWit outputs
The dashboard is live and is showing these stats and more at dashboard.bitcoinops.org.
The dataset used for the dashboard is also saved as a directory of JSON files, updated nightly. You can download the zipped dataset from our S3 bucket. If you just want the JSON file for a specific block, you can get it at: http://dashboard.dataset.s3.us-east-2.amazonaws.com/blocks/BLOCK_NUMBER.json If you’d rather recreate the data using your own full node (it might take a few days), you can use the code with instructions at github.com/bitcoinops/btc-dashboard.
An example JSON file with an explanation of added fields is available in the same repository.
Implementation
The rest of this post will be about my experience building the dashboard. To start, I looked at an existing tool for blockchain analysis, like BlockSci. Although BlockSci works pretty well, it has a long setup time and I was also looking to analyze blocks as they were being confirmed. In my experience using BlockSci, I found it very easy to write queries similar to those in the demo they produced, which took just a few minutes to return a result. The main downside with using BlockSci is that its parser takes a long time to pre-process blockchain data, but once that is done it performs quite well.
After exploring these options, I decided I could probably get most of the stats needed for the dashboard through RPCs from bitcoind. I wrote some simple code (using btcd’s RPC client) to get the stats I needed from each transaction with the getblock and getrawtransaction RPCs. This code worked pretty well for smaller blocks, but when I tried using it to get the stats of a more recent block - which often have over a thousand transactions - I quickly noticed a problem. My code was calling getrawtransaction for every single transaction input in the block. Asking bitcoind to do thousands of RPCs for every single block quickly becomes unsustainable, and was taking a very long time.
This code looked something like this:
block, err := rpcclient.GetBlock(blockHash)
for _, tx := range block.Transactions {
    for _, input := range tx.TxIn {
        analyzeInput(input)

        prevTx := rpcclient.GetRawTransaction(input.PreviousOutPoint.Hash)
        analyzePrevOut(input, prevTx)
    }

    for _, output := range tx.TxOut {
        analyzeOutput(output)
    }
}
I then started looking at the getblockstats RPC for some additional stats while I figure out a way around this problem. getblockstats is a new RPC in bitcoind expected to be released in Bitcoin Core 0.17. It gives several useful statistics for any given block. For example, the dashboard uses it to show evolving fee-rates, changes in the size of the UTXO set, and the number of inputs, outputs, and transactions for every block.
While looking through the code for the RPC, I realized the main loops in the RPC implementation were very similar to the main loops in my code. Both iterate through all transactions in a block, and for each transaction they collect stats while iterating through its inputs and outputs. The main difference was that my code had the additional overhead of thousands of RPCs. So, rather than dealing with the overhead of many RPCs, I decided I should modify this one RPC and get everything I need from a block in a single RPC.
I patched getblockstats in bitcoind to get the following stats:
-
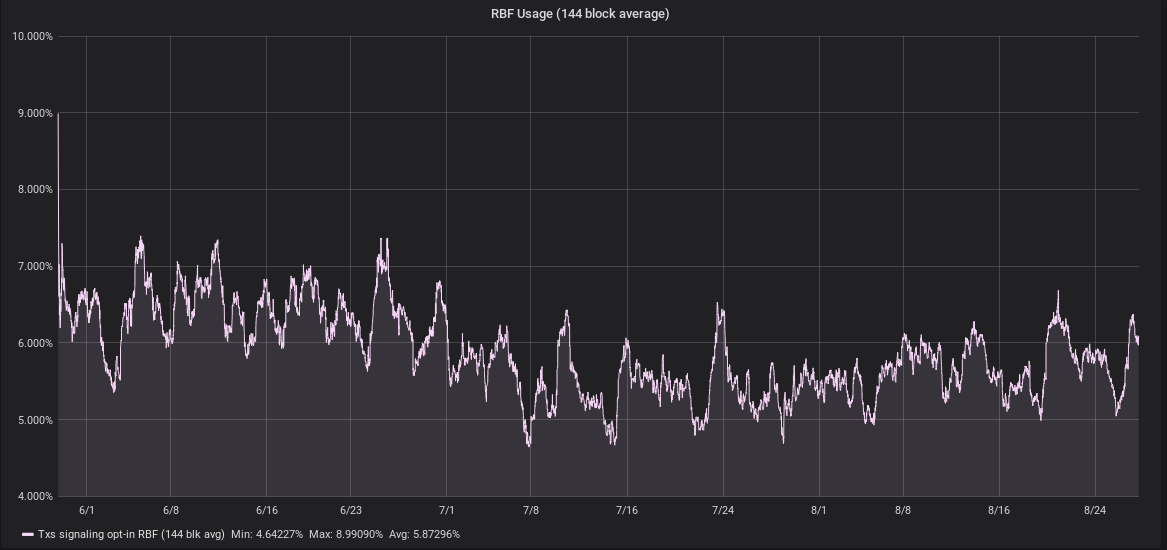
number of transactions that signal opt-in replace-by-fee (RBF)
-
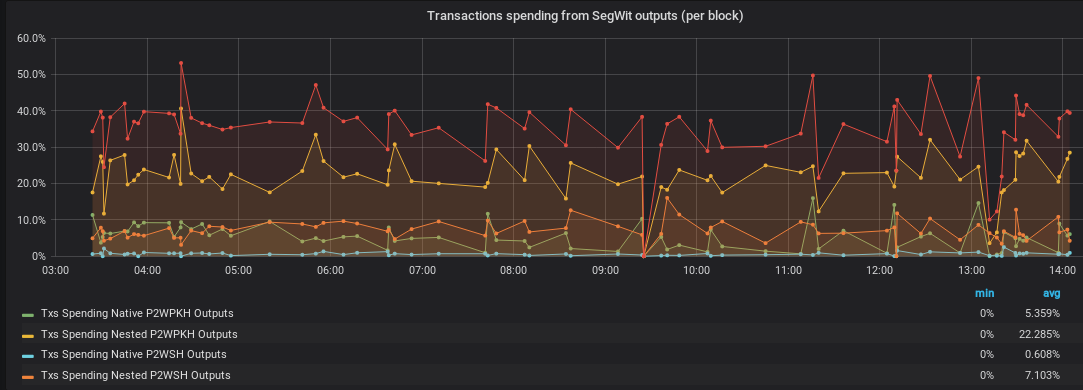
number of transactions (and inputs/outputs where it makes sense) that spend or create the different kinds of SegWit outputs: P2SH-Nested and Native (Bech32) variants of P2WPKH and P2WSH
-
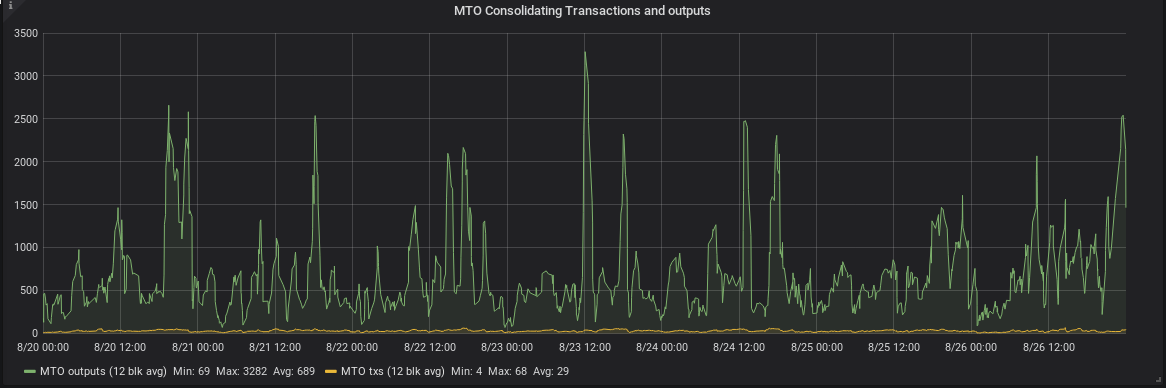
consolidation metrics: the number of transactions that consolidate many UTXOs into one transaction output, and the total number of outputs consolidated. The heuristic used is a “many-to-one” transaction: a transaction with at least 3 inputs and exactly 1 output.
-
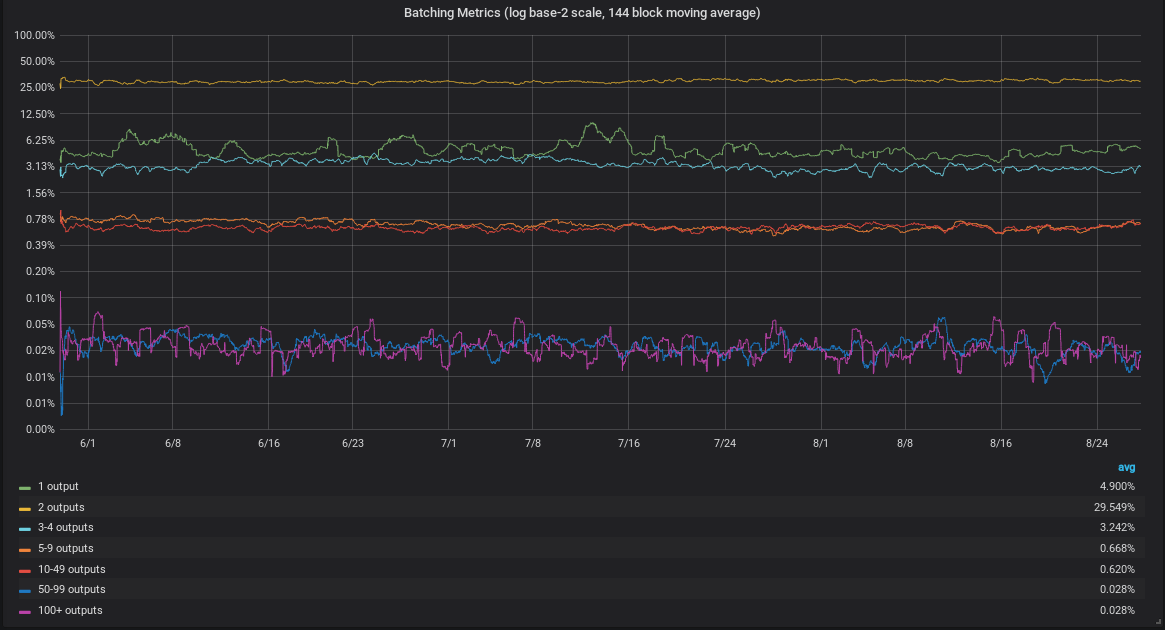
batching metrics: transactions that have many outputs, grouped by output counts in various ranges (inspired by a P2SH.info graph).
-
dust creation: the number of new UTXOs that would be considered dust at several different fee-rates.
The patch to getblockstats with these extra stats (and some more) is publicly available. I also patched the btcd RPC client for convenience to allow usage of getblockstats in the code I wrote.
Using bitcoind RPC efficiently
Using the getblockstats RPC to get data from the entire history of Bitcoin can still be pretty slow! Running the code to backfill data from all blocks on my desktop, it would have taken weeks to get all the data. After profiling bitcoind while it responded to getblockstats RPCs, we saw that as expected most of its time was spent retrieving transactions from the tx_index, so we configured bitcoind to better handle all these database reads:
- First, we increased the
dbcacheoption to around 2GB. Since most of the work done in the RPC is just reading through the database for blocks and transactions, this is pretty useful. - Second, we turned off the network connection of the node using
noconnectandnolisten. Without any network connections, a full node doesn’t really have anything to do except respond to RPCs.
One final performance improvement was just to use better hardware. I had been running the dashboard backfiller on my desktop where all my blockdata is on a HDD. After getting it running on a server with a SSD, database reads were much faster and therefore the backfilling process took much less time. On average, it was processing a block every 0.6 seconds. Tiny blocks with fewer transactions took even less time than that. With this setup, backfilling took just a few days.
Now that the historical data has been collected, the same setup is used to do a live analysis of incoming blocks. In this scenario (where the full node must be online and processing blocks) it still takes only 1-3 seconds to get results using getblockstats.
Databases
What do we do with all the data from getblockstats?
First, we derive some extra stats like “percentage of X that are Y” from the stats “X” and “Y” for the sake of convenience (the bitcoind patch doesn’t include these to give users the option to not have them and because they are trivial to compute). Then we store the result as a JSON file, and in a database. This is done in a program that uses the modified btcd RPC client described above. To make the graphs on our site we use Grafana, a tool for creating dashboards and visualizations, which makes queries into this database.
The first database I used was InfluxDB. I chose it because it seemed popular for Grafana dashboards and was easy to use and set up. Unfortunately, I quickly ran into some issues while using it. InfluxDB likes to use a lot of memory, around 14GB with the full dataset loaded. This is less of a problem if you throw hardware at it. With better hardware, we still ran into another issue of slow query times. After trying to tweak the settings I couldn’t find a way to make the situation much better.
In the dashboard, we want to be able to show historic trends, which means making queries that might ask for years worth of data. These queries were especially slow and often took over 60 seconds to make. After trying a bunch of different settings in InfluxDB, I decided to try a different database and compare the performance. Disclaimer: I don’t really know what I’m doing with InfluxDB and more or less was using default settings with some changes here and there. I will say that InfluxDB worked just fine for queries at smaller time-scales.
Postgres ftw
I looked at other databases people were using for Grafana dashboards and Postgres also seemed fairly common. It also has a reputation as a good database in other contexts. There are also a ton of Go packages that implement Postgres drivers, which is helpful because I wrote the program for collecting stats in Go. I chose go-pg as a Postgres driver basically at random. It worked right off the bat so I stuck with it.
Using go-pg you can define a table schema based off of the definition of a type, and even add constraints like notnull by just tagging the relevant struct fields in Go. To insert into the database, you just pass in a pointer to the struct of your choosing and it’s in.
// Table setup example
model := interface{}((*DashboardDataV2)(nil))
err = db.CreateTable(model, &orm.CreateTableOptions{
        Temp:        false,
        IfNotExists: true,
})
...
// Insertion example
err := worker.pgClient.Insert(&data.DashboardDataRow)
At this point I spent more time writing code to get information out of InfluxDB then on inserting it into Postgres. Once the switch to Postgres was done, the dashboard graphs came up much faster in Grafana.
Results
You can use the Bitcoin Optech dashboard to see these stats as historical trends from the entire history of Bitcoin, and also from new blocks as they get confirmed. All of this is available live on our dashboard at dashboard.bitcoinops.org!